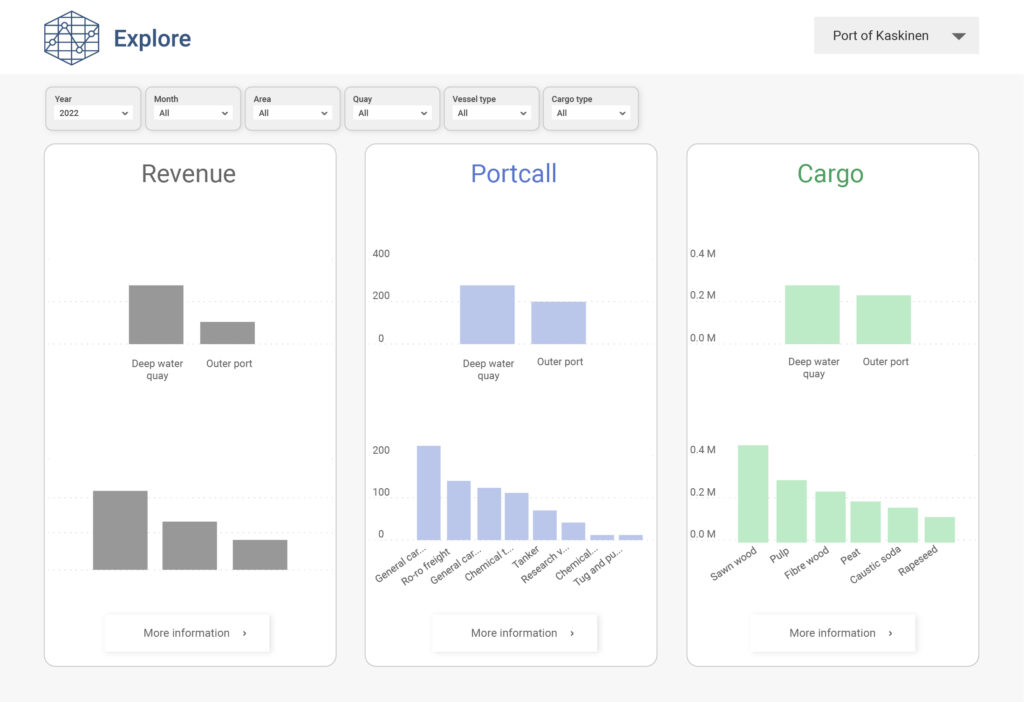
Port of Kaskinen is a vital hub for transportation and trade in the Gulf of Bothnia. Located on the western coast of Finland, the port handles a variety of cargo, including forestry products, bulk goods, and lately project cargo. With the recent implementation of the BI module, Explore, Port of Kaskinen is now better equipped to manage its operations and make data-driven decisions that enhance efficiency and increase profitability.
“We need to understand all aspects of our business to offer a competitive business environment for liners and landside partners. When they thrive, so do we and so do the local supply chain. The port’s new business intelligence solution will facilitate this understanding

” Ports require well-modeled rich datasets to make informed decisions for their business. We’re thrilled to see our long-term partner, Port of Kaskinen, leading the way in this effort.

Data warehouse for ports and terminals
Explore, integrated into Port of Kaskinen’s PMIS, contains multidimensional financial data, port call data, and cargo information. This data is visually presented, offering stakeholders the opportunity to drill down into various aspects to better understand root causes, profitability, and bottlenecks. Comparisons can then be done among the selection such as cargo, suppliers or vessels.

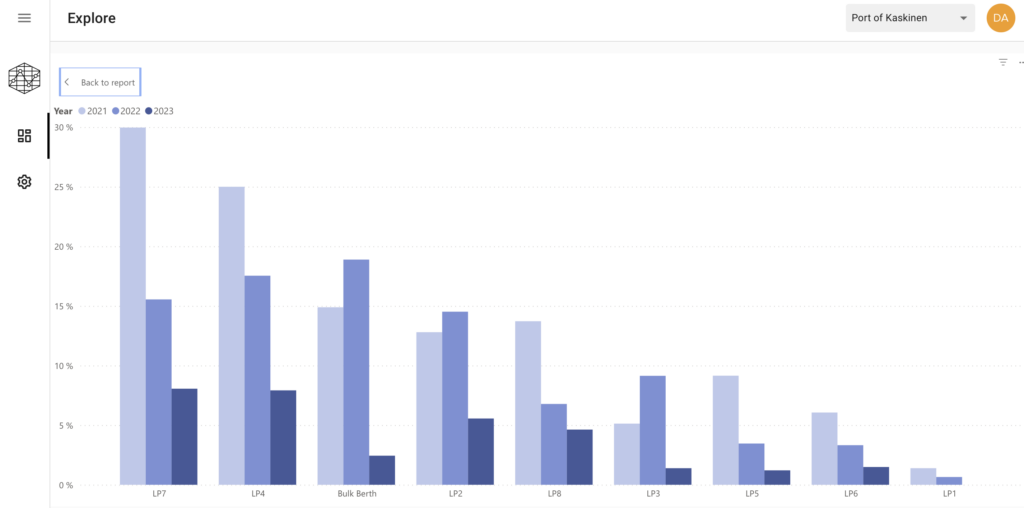
Lastly, trend charts complements the KPI dashboards providing a much needed long-term, holistic view of cyclical changes for the port. They can be viewed on aspects divided into revenue on areas, quays, customers and vessels; port calls performance and quays as well as cargo on type, origin, customer and quays

